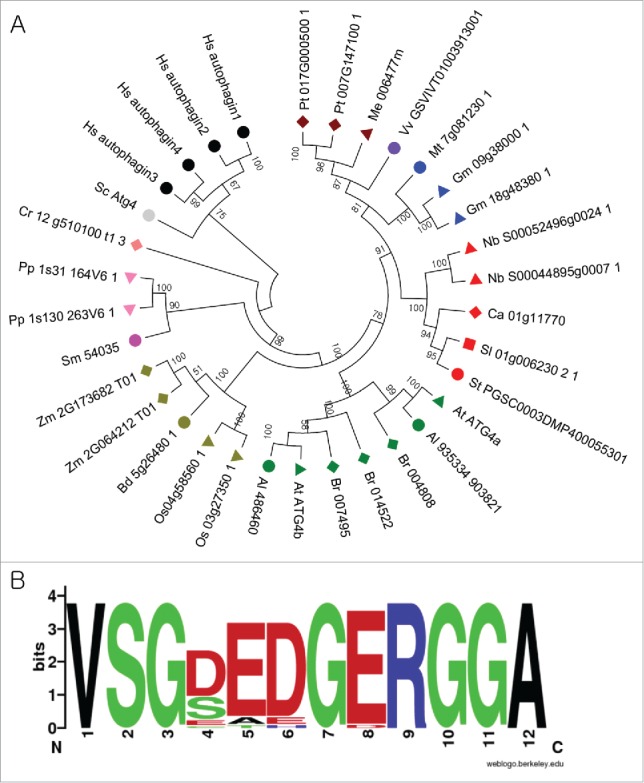
Figure 1.

Analysis of ATG4s from different plant species. (A) A phylogenetic tree was constructed using nucleotide sequences and amino acid alignments of ATG4 domains. The maximum likelihood model was used and ATG4s of human and yeast were used as outgroup. Bootstrap analysis was performed with 1000 replicates to support each branch. Same colors mean related species. Sc, Saccharomyces cerevisiae; Hs, Homo sapiens; Pt, Populus trichocarpa; Me, Manihot esculenta; Vv, Vitis vinifera; Mt, Medicago truncatula; Gm, Glycine max; Nb, Nicotiana benthamiana; Ca, Capsicum annum; Sl, Solanum lycopersicum; At, Arabidopsis thaliana; Br, Brassica rapa; Os, Oryza sativa; Bd, Brachypodium distachyon; Zm, Zea mays; Sm, Seleginella moellendorffii; Pp, Physcomitrella patens; Cr, Chlamydomonas reinhardtii. (B) Plant-specific motif in ATG4. Amino acid sequences of plant ATG4s were aligned and plant-specific motif logo was created using the alignment. The height of symbols indicates the sequence conservation and residue prevalence of multiple alignment positions.
