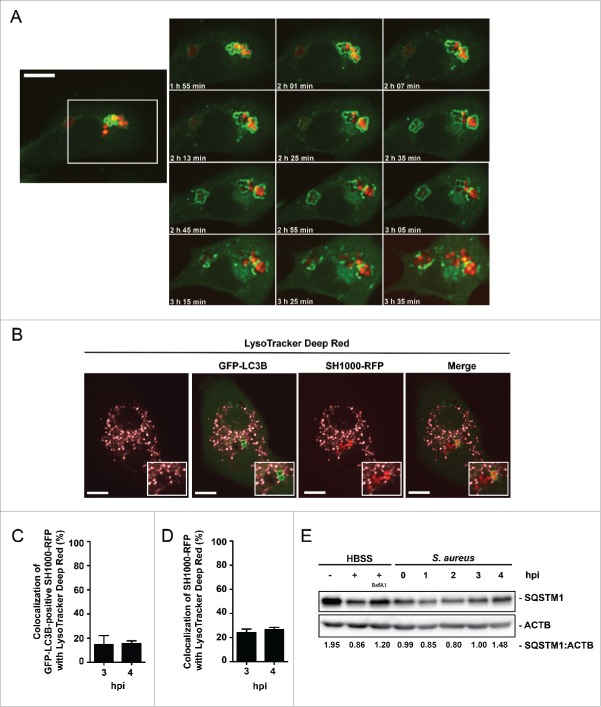
Figure 4.
Autophagosomal escape of S. aureus. (A) NIH/3T3 GFP-LC3B cells were infected with SH1000-RFP and recorded via live-cell imaging (recording 3 time points/min) shown are 12 time points. Scale bar, 13 µm. (B) NIH/3T3 GFP-LC3B cells were infected with SH1000-RFP and incubated with LysoTracker Deep Red, 3 hpi. Scale bars: 11 µm. (C) Quantification of the experiment shown in (B) for 3 and 4 hpi. The percentage of GFP-LC3B-positive intracellular S. aureus colocalizing with LysoTracker Deep Red is shown. 50 cells per time point were analyzed. Data are represented as mean ± SEM of 3 independent experiments. (D) Quantification of the experiment shown in (B) for 3 and 4 hpi. The percentage of total intracellular S. aureus colocalizing with LysoTracker Deep Red is shown. 50 cells per time point were analyzed. Data are represented as mean ± SEM of 3 independent experiments. (E) Wild-type MEF cells were infected with wild-type SH1000. As a negative control uninfected cells were included and as positive control cells were incubated for 3 h in HBSS with and without Baf A1. Cellular lysates were prepared and analyzed by immunoblotting using indicated antibodies. Normalization of ACTB/actin in comparison to SQSTM1 expression was analyzed with ImageJ.

