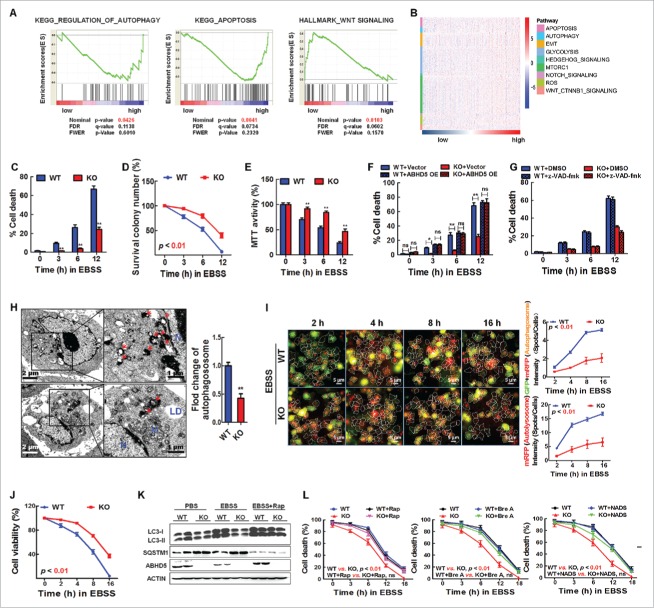
Figure 1.
Loss of ABHD5 suppresses CASP-independent cell death induced by nutrition deprivation. (A) GSEA plot of autophagy, apoptosis and WNT signaling pathways between ABHD5 high and ABHD5 low subgroups. (B) A heatmap of pathway enrichment signature in ABHD5 high and low subgroups. (C) ABHD5+/+ (WT) and ABHD5−/− (KO) colon epithelial cells (CCD841CON) were cultured in EBSS for 0, 3, 6 or 12 h, and the percentage of dead cells was determined at the indicated time points by trypan blue exclusion assay. (D) ABHD5+/+ (WT) and ABHD5−/− (KO) CCD841CON cells colonies were exposed to EBSS culture, and the colony survival was calculated at the indicated time points by crystal violet and trypan blue exclusion assay. (E) ABHD5+/+ (WT) and ABHD5−/− (KO) CCD841CON cells were cultured in EBSS for 0, 3, 6 or 12 h , and the cell viability was determined by MTT assay. (F) ABHD5+/+ (WT) and ABHD5−/− (KO) CCD841CON cells stably transfected with a wild-type ABHD5 expression plasmid or control empty vector were cultured in EBSS for 0, 3, 6 or 12 h, and the percentage of dead cells was determined at the indicated time points by trypan blue exclusion assay. (G) ABHD5+/+ (WT) and ABHD5−/− (KO) CCD841CON cells were cultured in EBSS in the presence of 50 μM z-VAD-fmk or control DMSO for 0, 3, 6 or 12 h, and the percentage of dead cells was determined at the indicated time points by trypan blue exclusion assay. (H) ABHD5+/+ (WT) and ABHD5−/− (KO) CCD841CON cells were cultured in EBSS for 3 h and analyzed by transmission electron microscopy. Arrows, autophagosomes; M, mitochondria; LD, lipid droplet; N, nucleus. The number of autophagosomes per cross-sectioned cell was counted. (I) ABHD5+/+ (WT) and ABHD5−/− (KO) CCD841CON cells were infected with GFP-RFP-LC3 adenovirus; 24 h after infection, high-content screen images showing RFP- and GFP-labeled LC3 staining in ABHD5+/+ (WT) and ABHD5−/− (KO) CCD841CON cells at different time points (2, 4, 8 and 16 h in the presence of EBSS culture). Scale bar: 5 μm. Statistical analysis showing autophagosomes, autolysosomes and the corresponding cell viability (J) in ABHD5+/+ (WT) and ABHD5−/− (KO) CCD841CON cells at the indicated timepoints. (K) Western blots of autophagy-related proteins (LC3-I, LC3-II, SQSTM1) in ABHD5+/+ (WT) and ABHD5−/− (KO) CCD841CON cells at 24 h following exposure to PBS, EBSS or EBSS+rapamycin (100 nM). (L) ABHD5+/+ (WT) and ABHD5−/− (KO) CCD841CON cells were cultured in EBSS in the presence of rapamycin (Rap, 100nM), dihydro-N-acetyl-d-erythro-sphingosine (NADS, 10 mM), brefeldin A (Bre A, 5 µM) or control PBS for 0, 3, 6, 12 or 18 h, and the percentage of dead cells was determined at the indicated time points by trypan blue exclusion assay. Unless noted, all bar plots in the figure are mean ± SEM of n biological replicates. (*, p < 0.01; **, p < 0.001; ns, no significance).

