Figure 5.
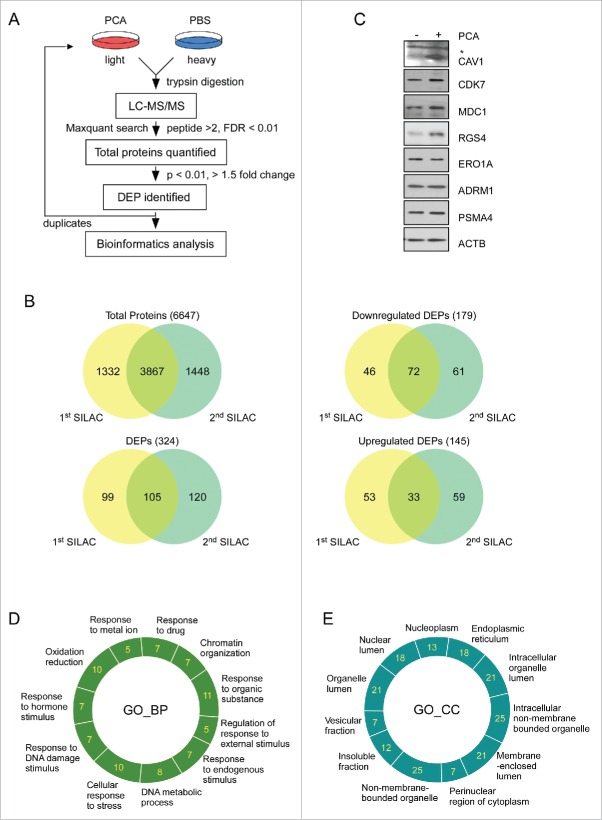
Quantitative proteomic analysis using PCA. (A) Overall work flow of the SILAC approach used to identify the targets of PCA. PCA-treated HeLa cell lysate (light) and stable-isotope-labeled amino acid-treated lysate (heavy) were mixed with equal amounts of total proteins. The trypsin-digested sample was analyzed with high-resolution LC-MS/MS. The analyzed sample was subjected to the search program “MaxQuant” and differentially expressed proteins (DEPs) were selected according to a P value standard of< 0.05, and 1.5-fold up- or downregulation. These processes are duplicated in an independent manner. (B) Venn diagram summary of total proteins and DEPs identified by SILAC. The intersections of 2 sets indicate commonly identified proteins from 2 SILAC analysis. (C) Immunoblotting analysis of DEPs. (D) and (E) GO analysis was carried out with the “DAVID” web-based program with parameters such as minimal count of 5 and P value of < 0.05. Important biological pathways (D) and cellular localizations (E) were enriched from DEPs. Analyzed DEPs were displayed by count number.

