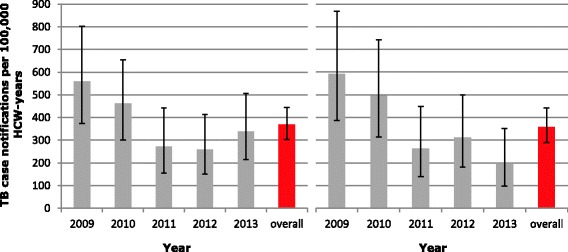
Fig. 1.

Reported annual TB case notification rate per 100,000 health care worker (HCW) years. Left panel includes all health facilities providing information on the number of TB cases and the number of HCW in any given year (2009-2013); right panel includes only the health facilities reporting this information for all five years. Error bars depict 95 % confidence intervals
