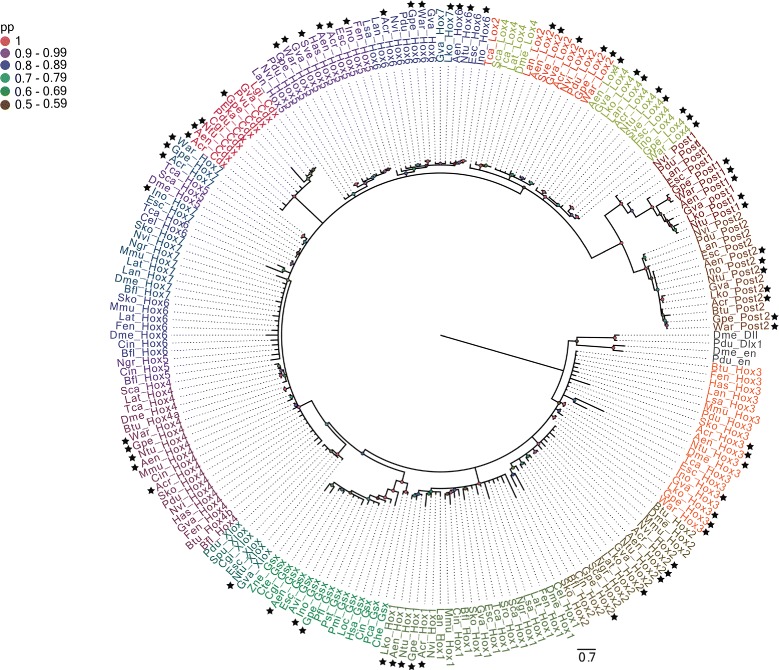
Fig. 1.

Phylogeny of Hox and ParaHox genes from amino acid sequences containing homeodomain and flanking regions. The consensus tree was inferred by Bayesian phylogenetic analysis with MrBayes v3.2.2 discarding 25 % of the sampled trees as burn-in. The branch support values are posterior probability values. The new Hox and ParaHox sequences identified in this study are highlighted by black stars. Hox and ParaHox paralog groups are represented by different colors. The homeobox genes distalless and engrailed were used as outgroups
