Fig. 6.

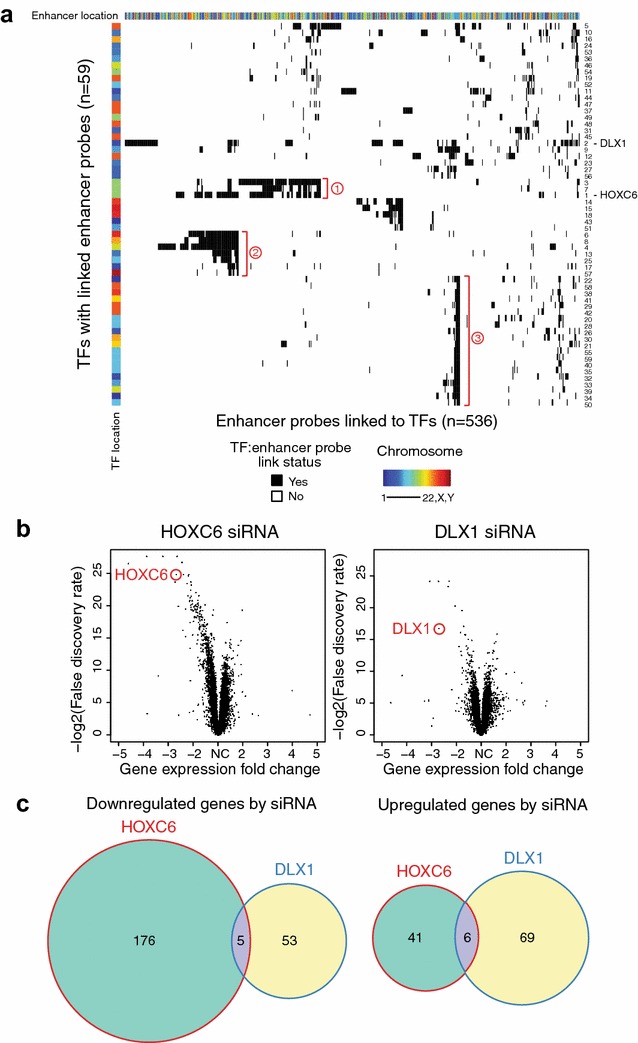
TFs linked to many tumor-specific enhancers in prostate tissues. a Unsupervised clustering of the enhancer probe:TF sets for PRAD for which a TF is associated with more than 10 hypomethylated (tumor-specific) enhancer probes. The rows indicate the 59 TFs, and the columns indicate the 536 hypomethylated enhancer probes linked to TFs; when there is a link, the cell is colored in black. On the top of the heatmap is shown the chromosomal location for each enhancer probe. On the left side of the heatmap is shown the chromosomal location for each TF. TF number on the right side indicates the TF rank, as determined by the number of linked enhancer probes for each TF (Additional file 6: Table S5). Three clusters of TFs that are linked to the same enhancers are marked by brackets with circled numbers. b Volcano plots identifying genes differentially expressed upon knockdown of HOXC6 and DLX1; triplicate control and knockdown samples were analyzed. c Venn diagrams of significantly down- or upregulated genes upon knockdown of HOXC6 and DLX1
