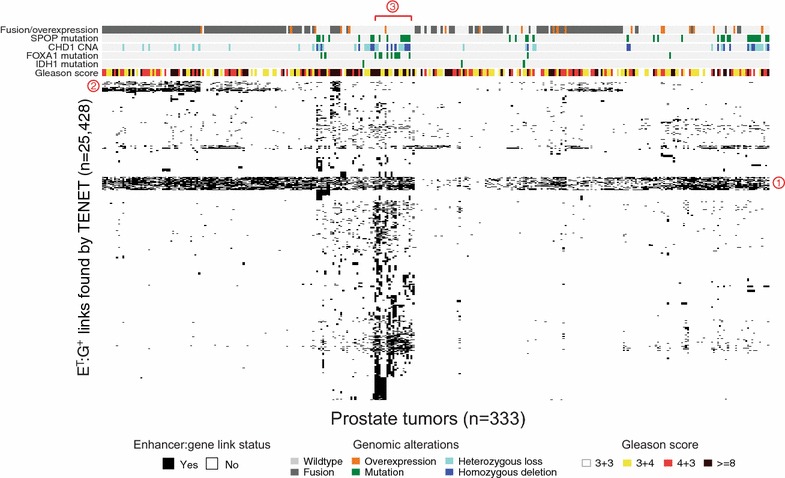
Fig. 7.

Heatmap of enhancer:gene links in prostate tumor tissues. Unsupervised clustering results using the ET:G+ links (n = 25,428) for prostate tumors (n = 333) with previously defined genomic alternations commonly found in prostate tumors and Gleason scores of the tumors [14]. Three clusters of ET:G+ links are marked by red-circled numbers
