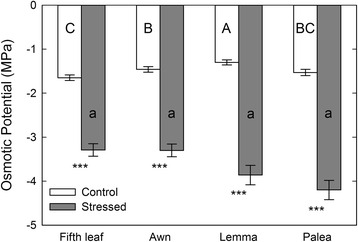
Fig. 2.

Changes in osmotic potential in the fifth leaf and spike organs of barley during drought. Osmotic potential was measured on the fourth day of drought treatment during grain filling. Significant differences between organs are indicated with lower case letters (stressed plants) and upper-case letters (control plants). Within a given organ, significant differences between treatments (control vs. drought) are indicated with asterisks, where * = P < 0.05, ** = P < 0.01, and *** = P < 0.001. Data are presented as the mean of six replicates ± SE. We used SigmaPlot 10.0 to make the figure
