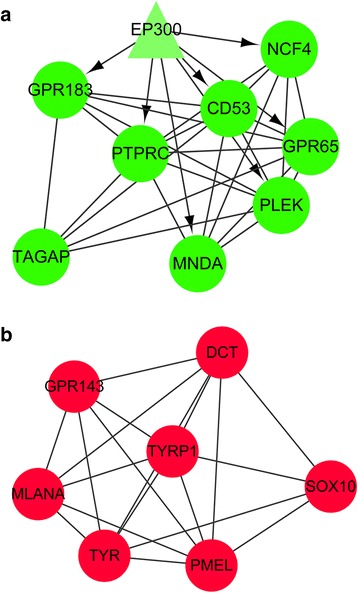
Fig. 5.

Two densely connected modules screened from the integrated network. a down-regulated module; b up-regulated module. Triangles represent transcription factors and circles represent differentially expressed genes. Red represents up-regulation while green represents down-regulation. –—, interactions between differentially expressed genes; →, regulatory effects of transcription factors on differentially expressed genes
