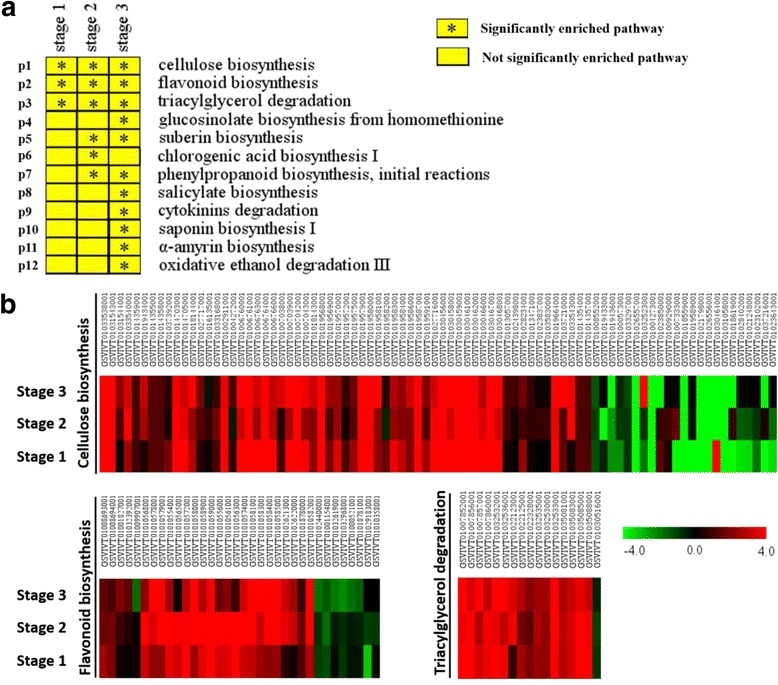
Fig. 4.

Pathway enrichment analysis of seeded and seedless grape seeds at three developmental stages. a Significantly enriched pathways at different seed developmental stages. Squares with ‘*’ indicate significantly changed pathways with P-value less than 0.05. b Expression profiles of genes in selected pathways (Log2-transformed fold-change of seedless reads per kilobase of exon model per million mapped reads (RPKM) relative to the seeded RPKM). All the genes were significant DEGs at least at one developmental stage. The maximum/minimum value was set to ±4.0
