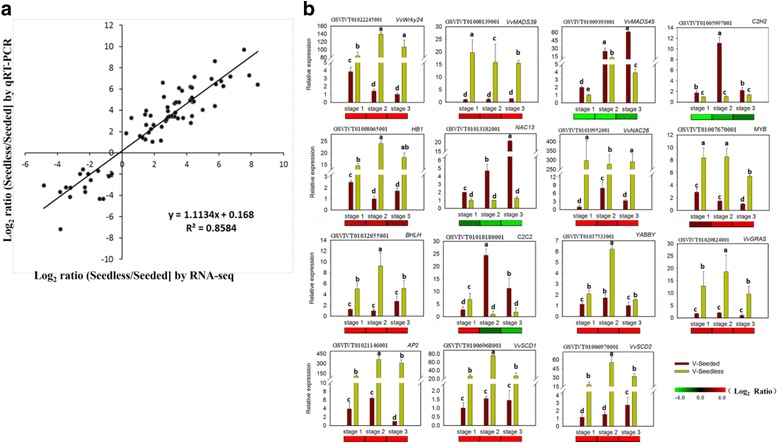
Fig. 8.

Verification of RNA-Seq results by qRT-PCR. a Correlation between RNAseq and qRT-PCR. The Pearson's correlation coefficient between relative expression levels is shown. b Fifteen genes were selected for validation of the RNA-Seq data by qRT-PCR. Heat maps under the histograms show a comparison of gene expression in the seeds of seedless and seeded progeny (Log2-transformed fold-change of seedless reads per kilobase of exon model per million mapped reads (RPKM) relative to the seeded RPKM at three developmental stages based on RNA-Seq results. The maximum/minimum value was set to ±4.0. ‘V-Seeded’ represents ‘seeded progeny used for verification’ and ‘V-Seedless’ represents ‘seedless progeny used for verification’
