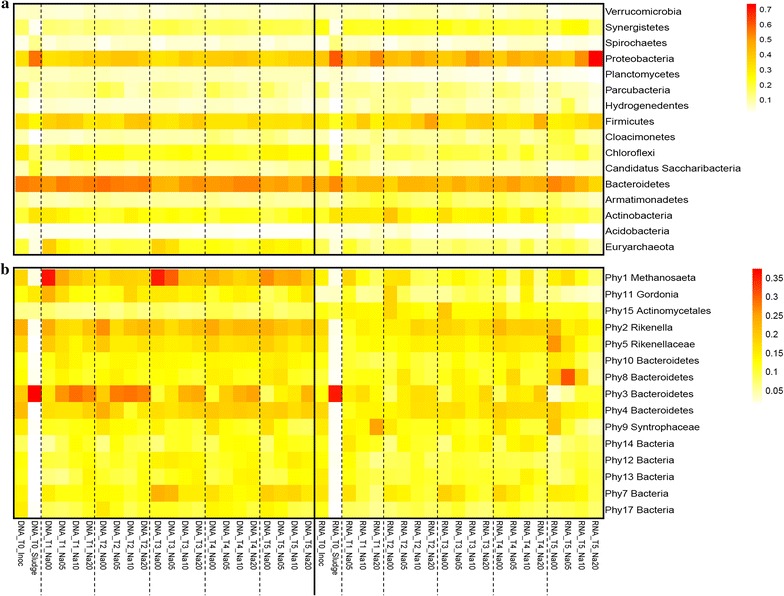
Fig. 2.

Heat map representing the microbial community of all samples a on phylum level at a relative abundance >0.1% averaged over all samples, and b the 15 main phylotypes that are present at a relative abundance >1% averaged over all samples. The colour scale ranges from 0 to 70% and 0 to 35% on phylum and phylotype levels, respectively. The different samples were labelled according to the time point (T0–T5) and salt concentration (0, 5, 10 and 20 g Na+ L−1). The inoculum sample (Inoc) at the start of the experiment as well as the feed sludge (Sludge) were also included in the heat map
