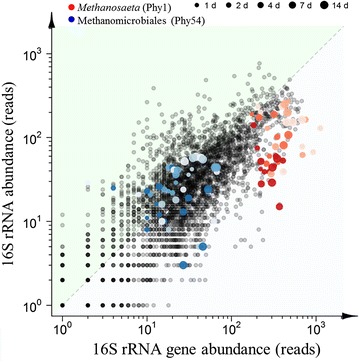
Fig. 7.

Comparison of RNA and DNA relative abundances of the selected 79 phylotypes in each of the samples (excluding the feed sludge sample). These 79 phylotypes had a relative abundance >0.1% in at least one sample and were present in all samples. The two most abundant methanogens [Methanosaeta, Phy1 (red) and an unclassified Methanomicrobiales phylotype, Phy54 (blue)] were highlighted, and the intensity of the colour relates to the salt concentration. The dashed line represents a DNA:RNA relative abundance ratio of 1
