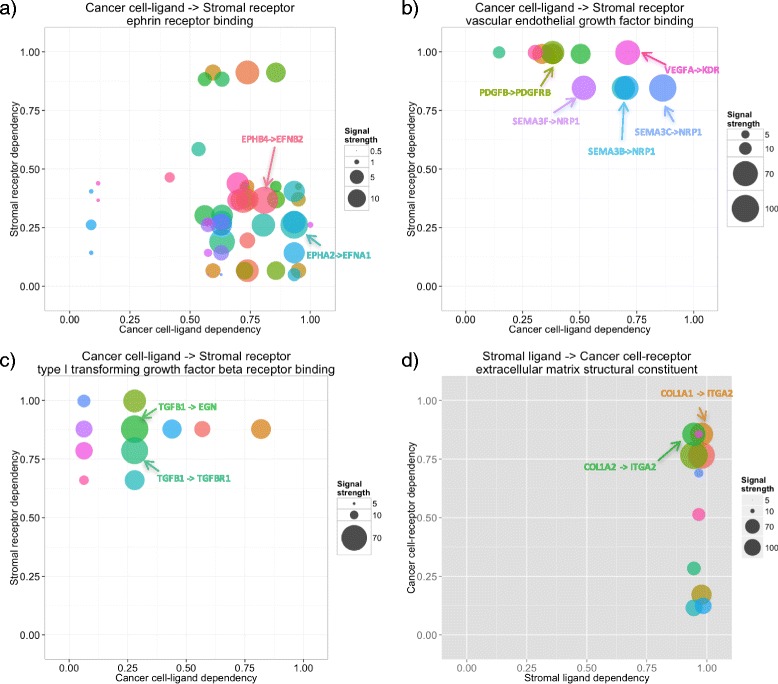
Fig. 7.

Interactome profiles of PDAC samples for various gene functional categories. a Ephrin receptor binding, (b) Vascular endothelial growth factor binding, (c) Type I transforming growth factor beta receptor binding and (d) Extracellular matrix structural constituent. Arrows highlight interactions referred to in the main text
