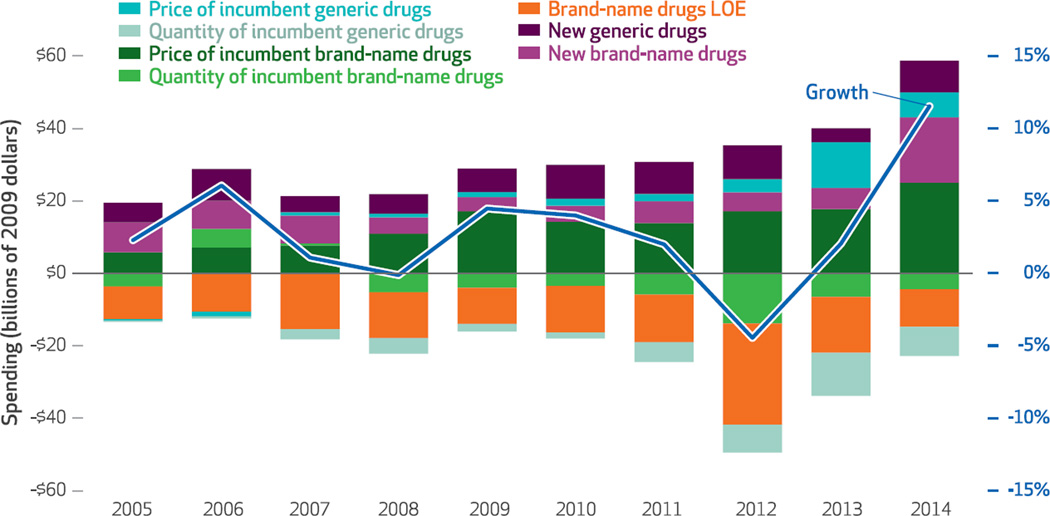
Exhibit 2. Price and quantity components of prescription drug spending based on invoice sales, and rate of spending growth.
SOURCE Authors’ analysis of data from the IMS National Sales Perspectives Dataset. NOTE Spending was adjusted to constant 2009 dollars using the St. Louis Federal Reserve quarterly gross domestic product price deflator series. Incumbent drugs are defined in the text. LOE is loss of exclusivity.

