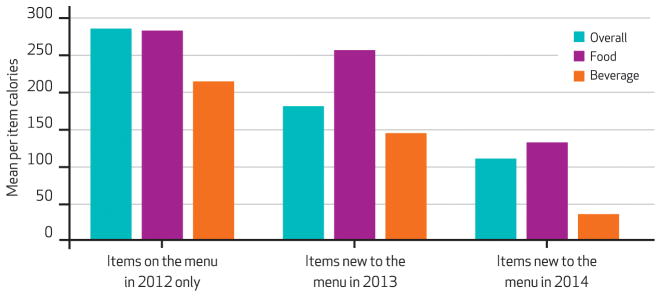
Exhibit 3. Predicted Difference In Mean Calories Between Restaurants Without Menu Labeling And Those That Voluntarily Implemented Menu Labeling Before 2014.
SOURCE Authors’ analysis of data from MenuStat (Note 12 in text) and data collected about restaurant characteristics and policies. NOTES All differences are positive because restaurants without labeling had more calories, compared to those with labeling, for overall, food (all menu categories except beverages and toppings or ingredients), and beverage categories. Mean per item calories in each year are predicted means from models that adjusted for children’s menu item status, whether an item was offered regionally or for a limited time only, whether a restaurant chain is national, the percentage of restaurant locations within each chain subject to local menu labeling regulation, and restaurant type (fast food, full service, fast casual). The within-group difference in calories for new menu items in 2014 compared to items on the menu in 2012 only was significant among restaurants with labeling and among those without it.

