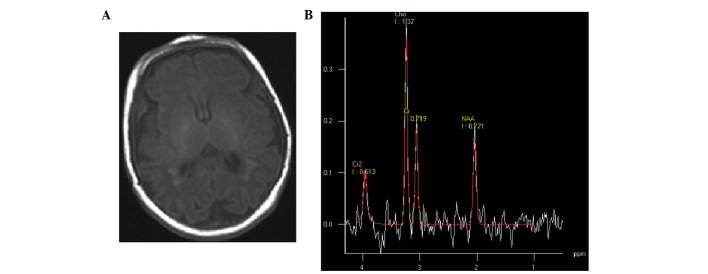
Figure 3.
(A) Severe hypoxic-ischemic encephalopathy neonate at 1 day of age. Transverse T1 weighted image showed multiple punctate hyperintensity surrounding the ventricle and low-signal-intensity areas on the corpus callosum. (B) Magnetic resonance spectroscopy (1500/35 ms) images of the basal ganglia; low levels of N-acetylaspartate were detected.

