Figure 2.

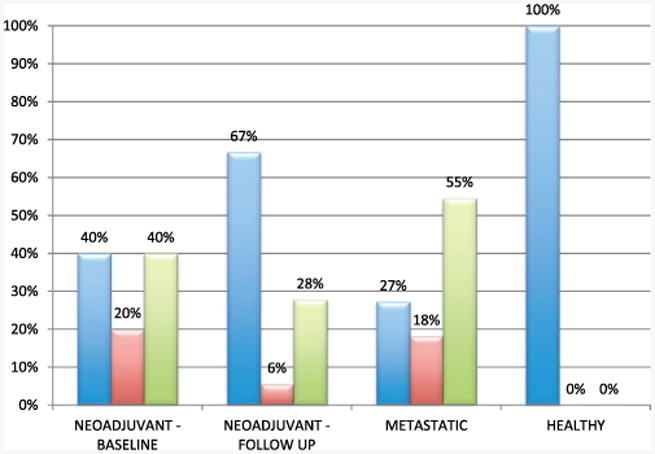
Enumeration results. CTC count in each cohort was grouped into bins of CTC low—less than 10 (blue bars), medium—10 to 30 (red bars) and high—greater than 30 (green bars), and reported as percent of each cohort.

Enumeration results. CTC count in each cohort was grouped into bins of CTC low—less than 10 (blue bars), medium—10 to 30 (red bars) and high—greater than 30 (green bars), and reported as percent of each cohort.