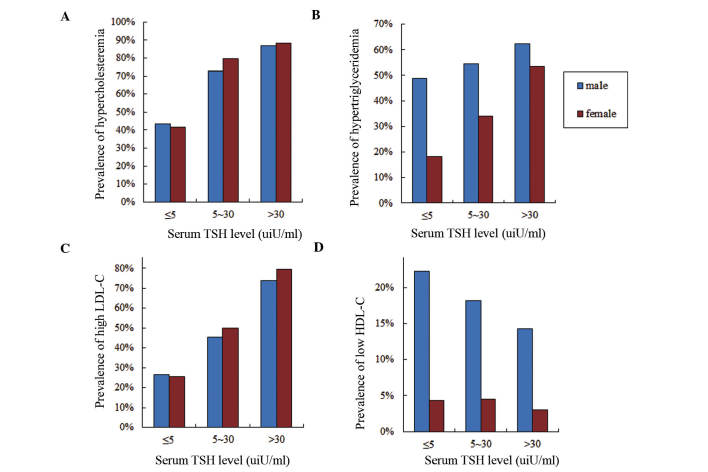
Figure 5.
Frequencies of dyslipidemia prevalences according to serum thyroid stimulating hormone (TSH) level and gender. Blue bars represent males and red bars represent females. Prevalence of (A) hypercholesteremia, (B) hypertriglyceridemia, (C) low-density lipoprotein-cholesterol (LDL-C) and (D) high-density lipoprotein-cholesterol (HDL-C).

