
Figure 1.
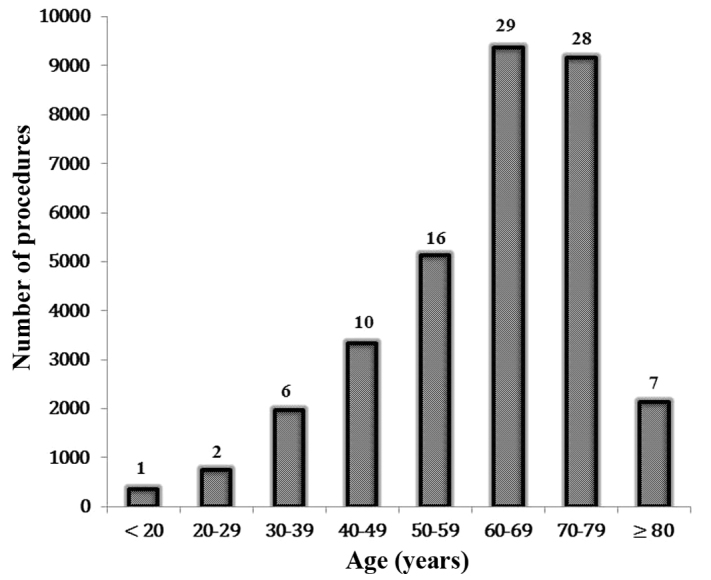
Age distribution for the treatment of aneurysms. The values above the data bars represent the percentage split.between the age ranges.
Official websites use .gov
A
.gov website belongs to an official
government organization in the United States.
Secure .gov websites use HTTPS
A lock (
) or https:// means you've safely
connected to the .gov website. Share sensitive
information only on official, secure websites.
Age distribution for the treatment of aneurysms. The values above the data bars represent the percentage split.between the age ranges.