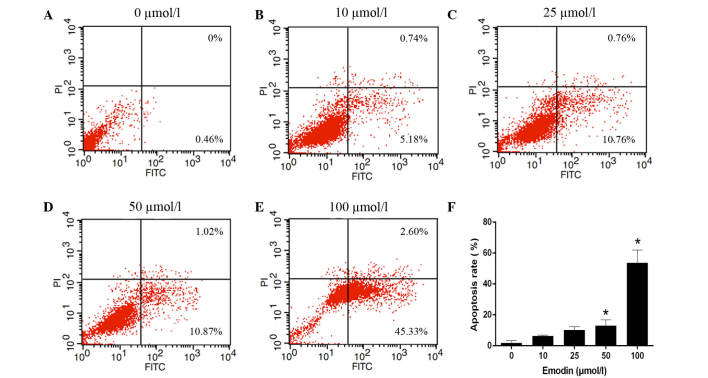
Figure 2.
Low dose emodin induced mild cells apoptosis. MHCC-97H cells treated with various concentrations of emodin for 24 h were stained with FITC-Annexin V/PI and analyzed by flow cytometry. The gate setting distinguished between living (lower left), necrotic (upper left), early apoptotic (lower right) and late apoptotic (upper right) cells. (A) Control group (0 µmol/l emodin); (B) 10 µmol/l emodin; (C) 25 µmol/l emodin; (D) 50 µmol/l emodin; (E) 100 µmol/l emodin; (F) The statistical analysis of the apoptosis rate, including the combination of early apoptotic and late apoptotic MHCC-97H cells. Data are presented as mean ± standard deviation (n=3). *P<0.05 vs. the control group (0 µmol/l emodin). FITC, fluorescein isothiocyanate; PI< propidium iodide.

