
Figure 3.
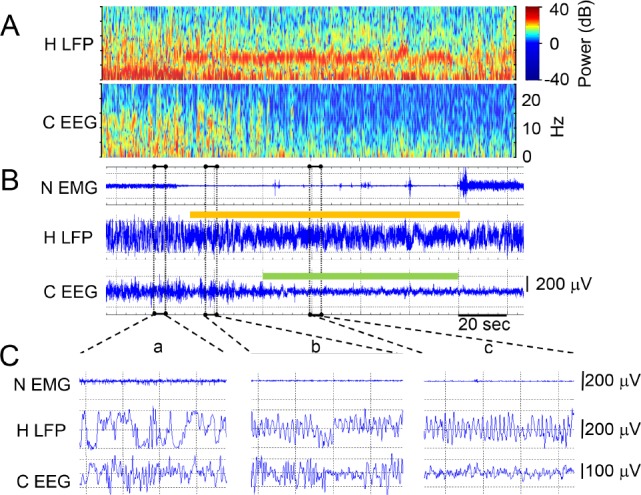
Example transition from slow wave sleep (SWS) through transition-to-REM sleep (TR) to rapid eye movement (REM) sleep in a rat recording during sleep after running the 8-box maze. An arousal terminates the REM period in the last 26 sec shown in panels A and B. (A) Power (color scale) and frequency (y axis) over time (x axis) of the hippocampal local field potential (H LFP) signal and the neocortical EEG (C EEG) signal from the same signals shown as traces in panel B and using the timescale bar from B. (B) Neck EMG (N EMG), H LFP, and C EEG signal traces over time. Epochs (10 sec) scored as REM are shown in the color bar separately over the hippocampal and neocortical traces just as they were independently scored. Three time periods outlined in dashed rectangles are expanded in panel C. (C) N EMG, H LFP, and C EEG traces from B expanded from 4 sec of simultaneous SWS (inset a), 4 sec of TR in the neocortex and REM in the hippocampus (inset b), and simultaneous REM (inset c).