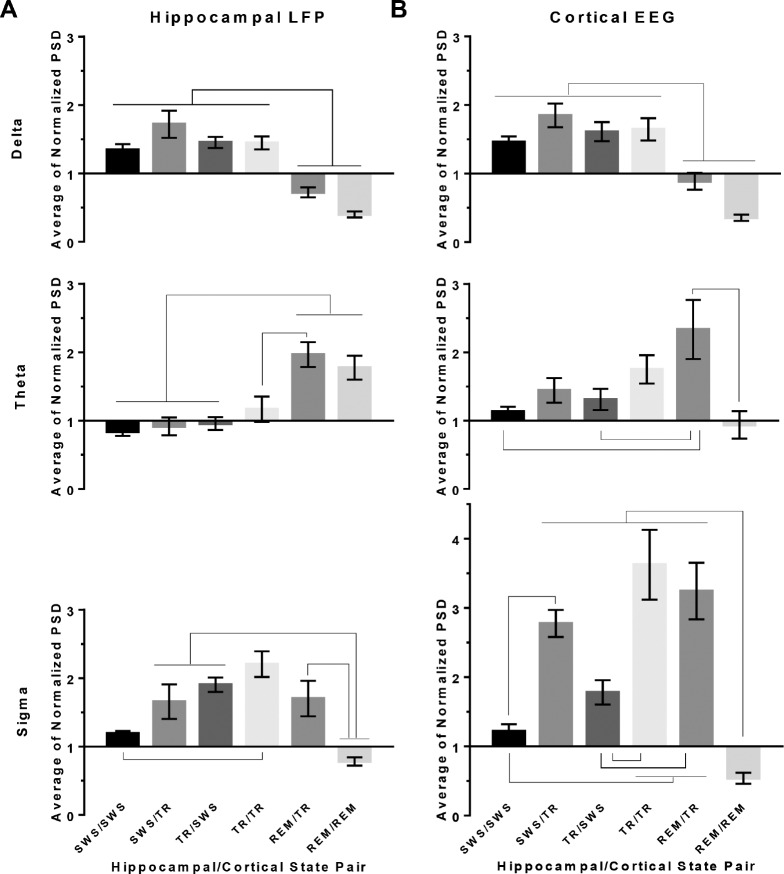
Figure 5.
Power spectral density by state-pair categories and band. Normalized power spectral density values (PSD) (mean ± standard error of the mean; n = 5 rats) are shown in the hippocampus (A) and neocortex (B) for delta, theta, and sigma bandwidths. Each 10-sec epoch PSD in each frequency band was normalized by the respective mean PSD across the entire recording period for each rat. State-pair categories are denoted as “hippocampal state/neocortical state”. Connectors between state-pair indicate statistically significant differences (P < 0.05, Holm-Sidak multiple comparisons test). REM = rapid eye movement sleep; SWS = slow wave sleep; TR = transition-to-REM sleep.

