
Figure 6.
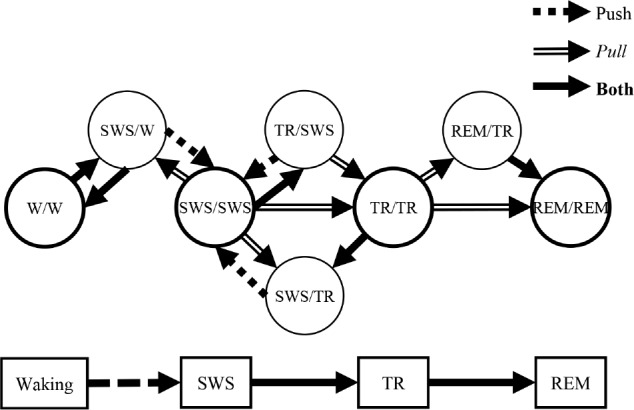
Statistically significant state-pair category progressions. Statistically significant state-pair category progressions are shown with arrows signifying direction of each progression. Expected counts were calculated as the product of the total counts of the final state-pair category and the proportion of total epochs of the prior or subsequent state-pair category. Push lines indicate where a state-pair goes next with statistical significance, and Pull lines represent from whence a state-pair originates. The Push and Pull percentages of these transitions are presented in Tables S1 and S2 in the supplemental material, respectively. Individual circles correspond to separate state-pair categories with simultaneous states denoted as “hippocampal state/neocortical state.” (P < 0.05, χ2 Goodness-of-fit test, degrees of freedom = 1). REM = rapid eye movement sleep; SWS = slow wave sleep; TR = transition-to-REM sleep; W = waking.