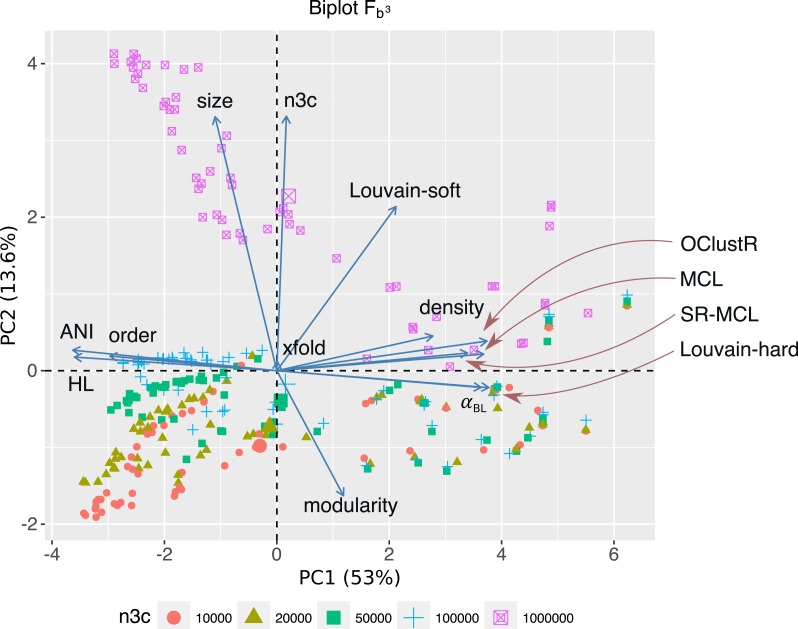
Figure 5. For the 300 3C-contig graphs pertaining to uniform abundance, a PCA biplot is shown for the two most significant components (PC1, PC2).
Respectively, PC1 and PC2 explain 53% and 13.6% of the variation within the data-set. Here vectors represent sweep variables, while points represent individual 3C-contigs graphs and are coloured by 3C sequencing depth (n3c: 10k–1M pairs). Double-sized points show mean values of these n3c groupings. Vectors labelled after the five clustering algorithms represent performance as measured by scoring metric FB3 (Eq. 1). PC1 and PC2 explained 53% and 13.6% of the variation within the data-set respectively. PC1 was most strongly correlated with graphical complexity (HL) and the number of graph nodes (order), which come about with decreasing evolutionary divergence (ANIb and αBL) and explained the majority of variation in performance for four out of five clustering algorithms. The notable exception was Louvain-soft which had significant support on PC2. PC2 was related to HiC/3C sampling depth (n3c), which correlated strongly with the number of graph edges (size). The positive response Louvain-soft had to increasing the number of HiC/3C read-pairs (n3c) relative to the remaining four algorithms is evident.

