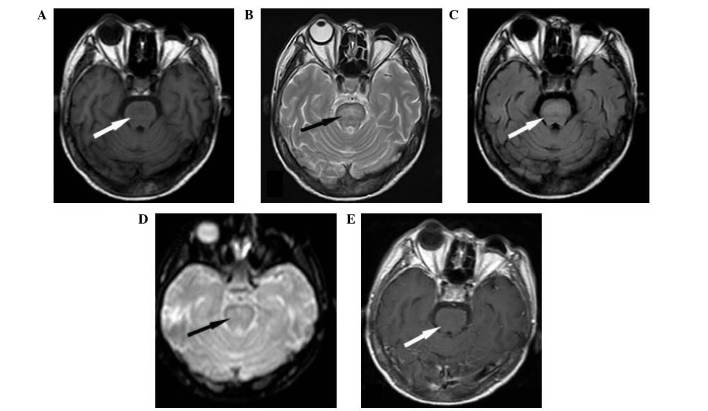
Figure 1.
Central pontine myelinolysis on magnetic resonance imaging. (A) T1 weighted imaging (WI) showing a hypointense lesion in the pons in white arrow. (B) T2WI and (C) fluid-attenuated inversion-recovery-weighted imaging showing a hyperintense lesion in the pons in black or white arrow. (D) Diffusion-weighted imaging indicating abnormal restricted diffusion manifested by increased signal in black arrow. (E) T1WI without contrast enhancement in white arrow.

