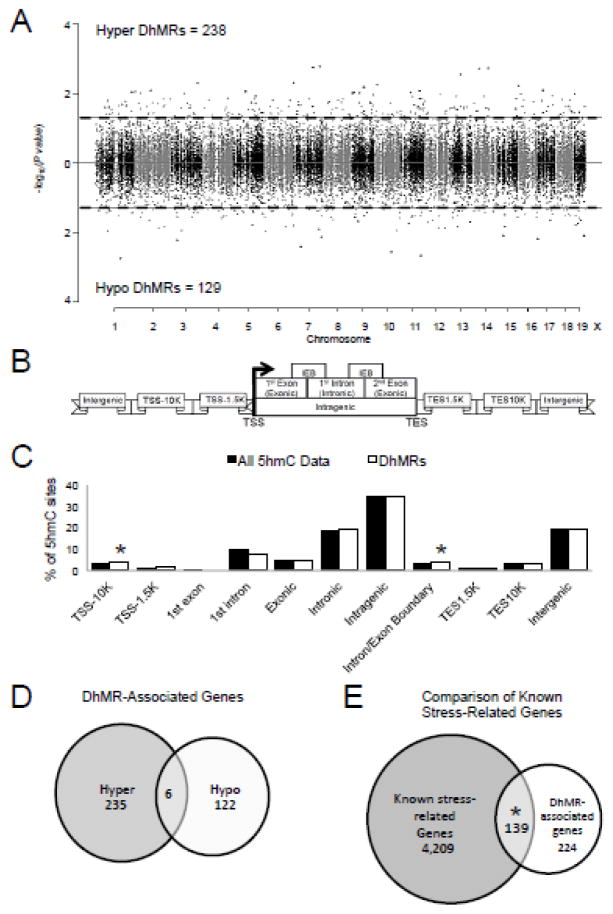
Figure 1.
Characterization of differential 5hmC across standard genomic structures in acutely stressed females. A. Modified Manhattan plot of female acute stress induced disruptions of 5hmC across the genome. Each point represents a genomic region containing 5hmC (~1kb in size). Points above zero represent increases in 5hmC (hyper) and points below zero represent decreases in 5hmC (hypo). While all regions containing 5hmC alternate between black and gray to indicate each chromosome, significant changes in 5hmC abundance (DhMRs) are found outside the dashed lines (P-value < 0.05). B. Schematic of standard regions of the genome. 5hmC and DhMR data were classified into the following genomic locations: 10 kilobases (kb) upstream of the transcription start site (TSS; TSS-10K); 1.5 kb upstream of the TSS (TSS-1.5K); 1st exon; 1st intron; Exonic; Intronic; Intragenic; Intron/Exon boundary (IEB); 1.5 kb downstream of the transcription end site (TES1.5K); 10 kb downstream of the TES (TES10K); or intergenic regions. Hydroxymethylation data were binned into these groups based on the density of sequence reads. C. Enrichment of 5hmC across genomic structures. The percent distribution (y-axis) of all 5hmC data (black) and DhMRs (white) across each genomic structure is shown with significant enrichments indicated with an asterisk (P-value < 0.05). D. Venn diagram of DhMR-associated genes. Shown is the relative abundance of hyper and hypo DhMR-associated genes and their overlap. E. Venn diagram of DhMR-associated genes compared to stress-related genes. Shown is the significant overlap of DhMR-associated genes and known stress related genes from the literature (GeneCard). An asterisk indicates P-value < 0.05.

