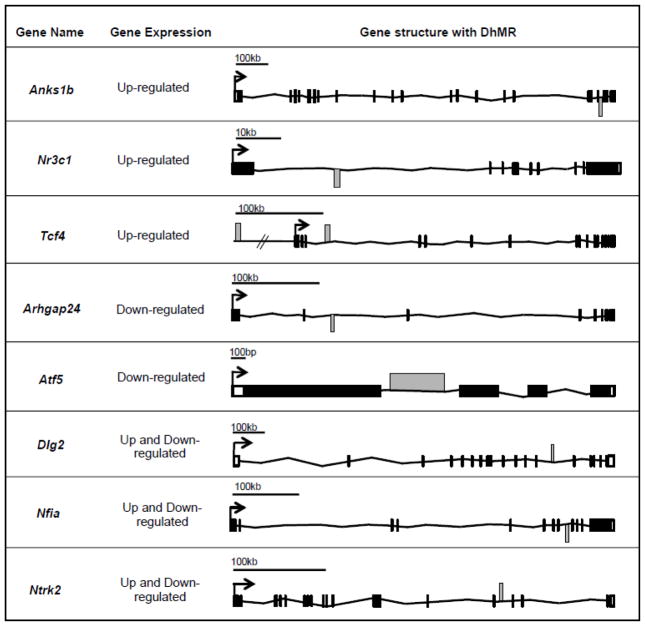
Figure 2.
Potentially functional DhMR-associated genes. Shown are representative DhMR-associated genes that have altered transcript levels following exposure to acute stress. The name of each gene and the direction of expression change is shown to the left of each gene schematic, which depicts the relative location of each transcription start site (TSS; broken arrow), exon (white and black boxes), intron (black horizontal line connecting exons), and hyper- or hypo-DhMR (grey box above or below each gene, respectively).

