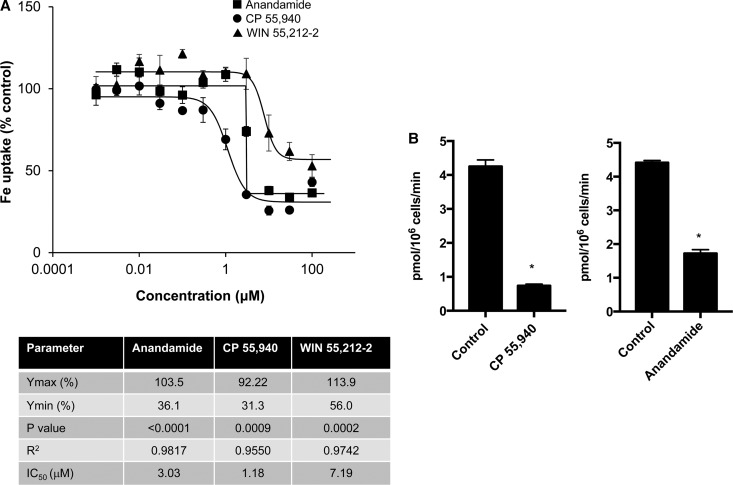
Figure 1. Dose–response studies of DMT1 inhibition by cannabinoids.
HEK293T(DMT1) cells were incubated at 37°C for 20 min with 0.001–100 μM of the indicated compounds as described in the Experimental Procedures section (n = 6). Shown are curves fit by regression analysis with symbols indicated in (A). (B) 54Mn uptake in the absence and presence of 50 µM anandamide or CP55,940. Shown are means (±SEM) for control cells incubated with vehicle (DMSO) and indicated drug (n = 3); results from one experiment with similar results obtained on at least one other occasion (*P < 0.0001). Dose response curves were best fit by a Hill four-parameter sigmoidal model with values obtained for Ymax, Ymin, and IC50 shown in the inserted table. The P-values and R2 for each of the curve fits are also provided.

