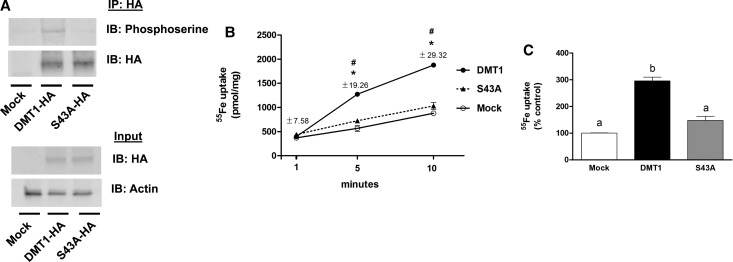
Figure 5. DMT1 phosphorylation at serine 43.
(A) HEK293T cells were transfected to express DMT1-HA or S43A-HA, and immunoprecipitation and immunoblot analysis were performed as described in Figure 3. (B) Time course of iron uptake by HEK293T cells transfected to express HA-DMT1 (closed circles) or HA-DMT1(S43A) (closed triangles) compared with mock-transfected control (empty circles) cells (n = 3). Similar results were obtained in at least two independent experiments. *P < 0.05 vs. control; #P < 0.05 vs. S43A. SEM values are provided since errors bars are too small to visualize. (C) The extent of iron uptake over a 20-min incubation period was determined for HEK293T cells transfected to express DMT1-HA (filled bar), S43A-HA (gray bar) or mock-transfected (open bar). Results shown are means ± SEM (n = 3) with similar results obtained in at least two independent experiments (n = 3). Means with different letters are significantly different by one-way ANOVA followed by Tukey's multiple comparisons test (P < 0.0001).

