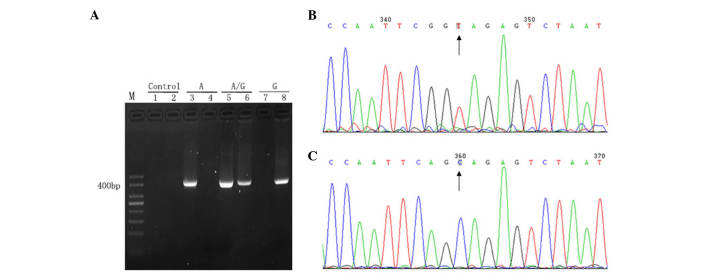
Figure 1.
Analysis of primer specificity. (A) Gel electrophoresis of the PCR products. Lane M, 50 bp DNA ladder; lane 1, negative controls of wild-type primers (ddH2O instead of DNA template was added to the PCR); lane 2, negative control of mutation patterns (ddH2O instead of DNA template was added to the PCR); lanes 3 and 4, plasmid with wild-type sequence amplified using wild-type (lane 3) and mutant (lane 4) primers; lanes 5 and 6, plasmid with mutant and wild-type sequences amplified using wild-type (lane 5) and mutant (lane 6) primers; lanes 7 and 8, plasmid with mutant sequence amplified using wild-type (lane 7) and mutant (lane 8) primers. (B and C) Reverse sequence (detecting the sequence of the complementary strand) results of PCR products extended using two pairs of primers: (B) Wild-type (TA) and (C) mutant (CG). Results were unimodal, which indicated high specificity of the primers. Subsequently, these primers were used to amplify reconstructed plasmids. PCR, polymerase chain reaction; dd, double distilled.

