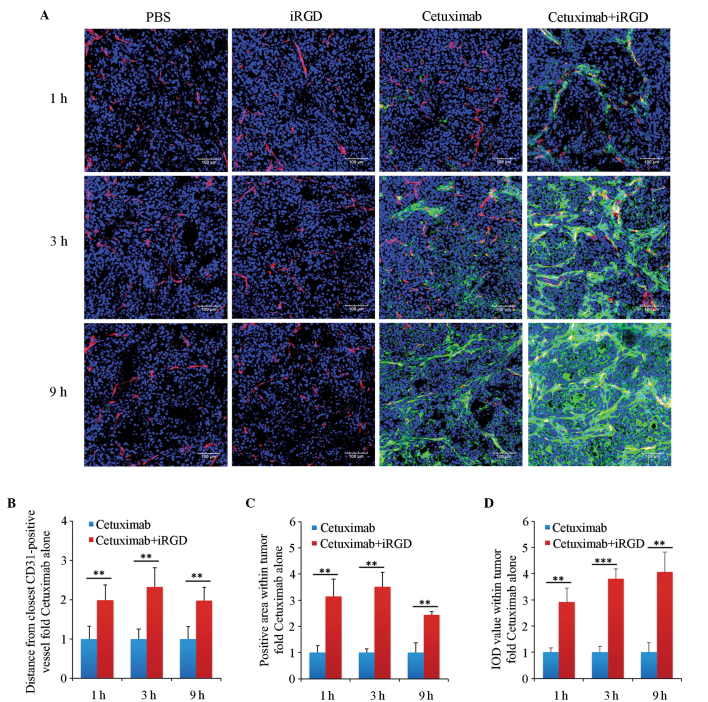
Figure 2.
Penetration analysis of cetuximab in extravascular tumor tissues. (A) Immunofluorescence staining analysis. Tumor vasculature was stained with an anti-mouse cluster of differentiation 31 antibody. Cetuximab was stained with an anti-human IgG antibody. The nuclei were stained with 4′,6-diamidino-2-phenylindole. Representative images from 3 tumors per group are shown; magnification, ×200; Scale bars=100 µm. (B) Quantification analysis of the penetrating depth of cetuximab in tumor tissues. (C) Quantitative analysis of the diffusing area of cetuximab in tumor tissues. (D) Quantitative analysis of the accumulated amount of cetuximab in tumor tissues. Five randomly selected fields in each section per tumor were analyzed with Image-Pro Plus software. n=3; Error bars, mean ± standard deviation; **P<0.01; ***P<0.001. PBS, phosphate-buffered saline; iRGD, internalizing RGD peptide.

