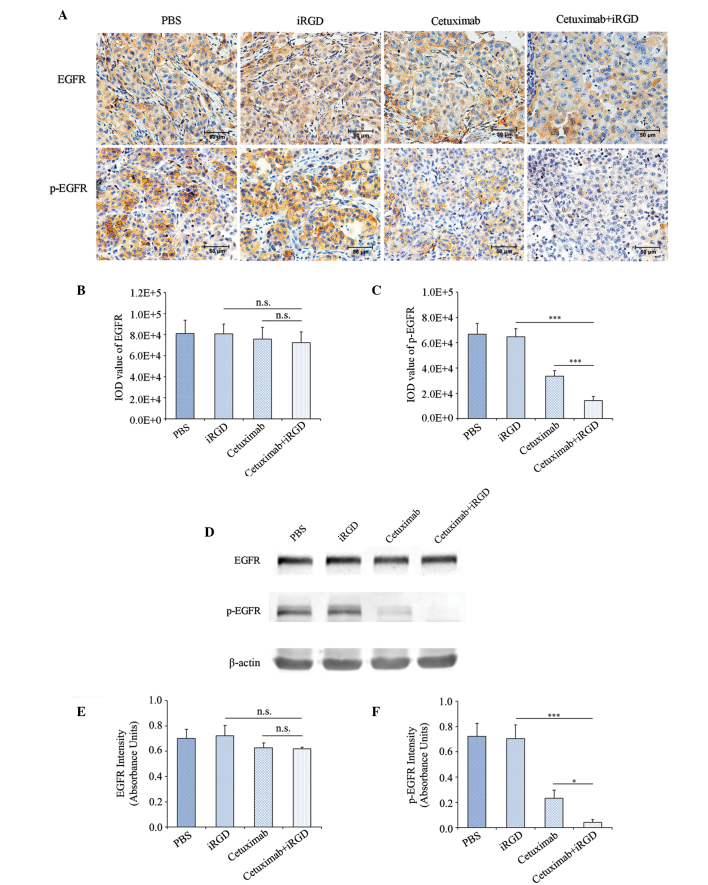
Figure 4.
The inhibition of EGFR phosphorylation following co-administration of cetuximab and iRGD. (A) Immunohistochemical staining analysis. EGFR and p-EGFR positive cells in the sections are stained brown. The nuclei are stained blue. Representative figures from each group are shown; n=6; magnification, ×400; Scale bars=50 µm. Quantitative analysis results of (B) EGFR and (C) p-EGFR for part (A). Five fields of each tumor tissue section were randomly selected for the calculation of the IOD value of the positive region through Image-Pro Plus software, which indicated the amount of antigen expression. (D) Western blot analysis. Total protein from the tumor tissues was extracted. EGFR and p-EGFR were detected with β-actin as an internal control. n=3. Quantitative analysis results of (E) EGFR and (F) p-EGFR of part (D). The intensity of each strip was analyzed by ImageJ software. The average intensities of EGFR and p-EGFR were standardized to β-actin. Error bars, mean ± standard deviation; ns, not significant; *P<0.05; ***P<0.001. EGFR, epidermal growth factor receptor; p-EGFR, phosphorylated-epidermal growth factor receptor; PBS, phosphate-buffered saline; iRGD, internalizing RGD peptide; IOD, integrated optical density.

