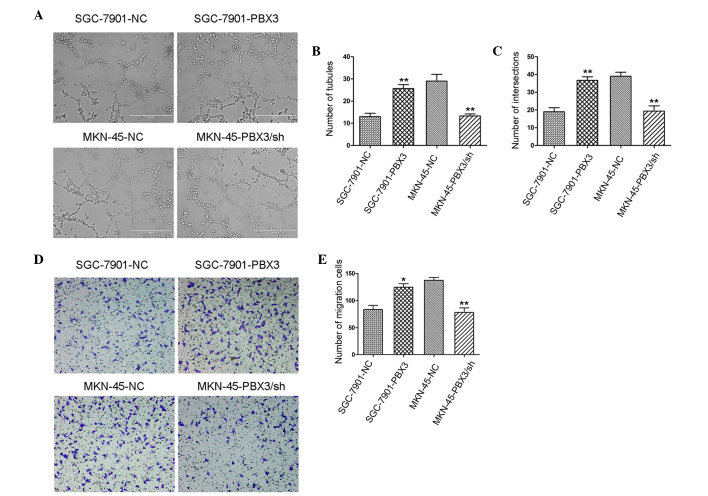
Figure 3.
Effect of PBX3 on tubular formation in vitro. (A) An increased number of tubes was observed in the SCG-7901-PBX3 groups compared with the control groups, whereas the MKN-45-PBX3/sh groups formed less tubes than the control groups (magnification, ×200). Bar charts show (B) the number of tubes, and (C) the number of intersections between different groups. (D) The supernatant of GC cells was collected after 24 h culture. Overexpression of PBX3 increased the migration of HUVEC cells, whereas knockdown of PBX3 decreased the migration of HUVEC cells (magnification, ×100). (E) Histograms showed the number of migratory cells. *P<0.05; **P<0.01. Data are represented as mean ± standard deviation of three independent experiments. PBX3, pre-leukemia transcription factor 3; GC, gastric cancer.

