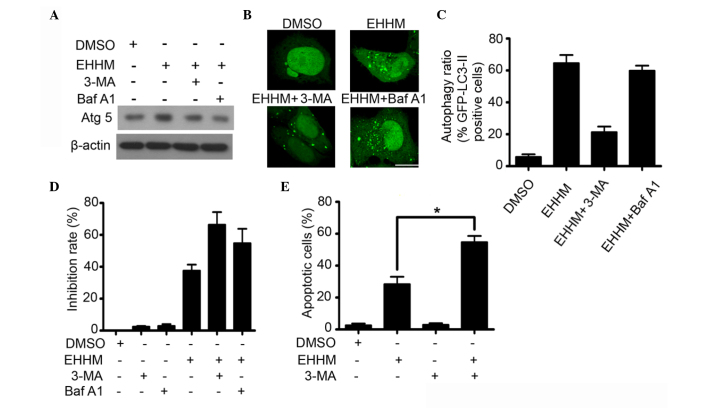
Figure 5.
Autophagy inhibition enhances the growth inhibitory and pro-apoptotic effects of EHHM. (A) HepG2 cells were treated with 3-MA or Baf A1, followed by EHHM (15 µM) treatment for additional 24 h. Western blot analysis was performed to detect the expression levels of Atg5 and Beclin 1. (B) HepG2 cells transfected with a GFP-LC-3-expressing plasmid were treated with 3-MA or Baf A1, followed by treatment with EHHM (15 µM) for additional 24 h. The cells were then observed under a confocal microscope, and (C) the ratios of cells with autophagy formation were calculated. Scale bar, 10 µm. (D) HepG2 cells were treated with 3-MA or Baf A1, followed by treatment with EHHM (15 µM) for additional 24 h, and the cell inhibition rate was then analyzed by 3-(4,5-dimethylthiazol-2-yl)-2,5-diphenyltetrazolium bromide assay. (E) HepG2 cells were treated with 3-MA, followed by EHHM (15 µM) treatment for additional 24 h, and the apoptotic cell death rate was analyzed by annexin V/PI staining and flow cytometry. Data represent the mean ± standard deviation of three independent experiments (*P<0.05). EHHM, E-[6′-(5′-hydroxypentyl)tricosyl]-4-hydroxy-3-methoxycinnamate; GFP, green fluorescent protein; LC3, light chain 3; Atg5, autophagy protein 5; p-, phosphorylated; mTOR, mechanistic target of rapamycin; p70S6K, p70 ribosomal protein S6 kinase; siRNA, small interfering RNA; DMSO, dimethyl sulfoxide; Baf A1, bafilomycin A1; 3-MA, 3-methyl adenine; PI, propidium iodide.

