
Figure 1. Genomic Structure among Late Pleistocene Horses in Blue, DHs in Red, and PHs in Green.
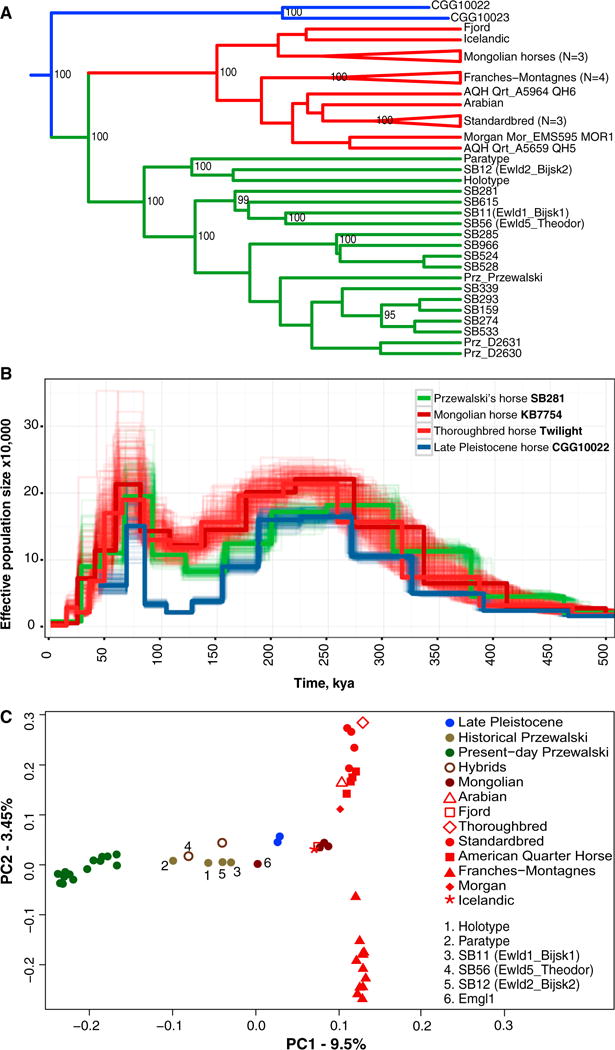
(A) Exome-based ML tree. Nodes show bootstrap support ≥ 95%. AQH, American Quarter Horse.
(B) PSMC profiles. Thin lines represent 100 bootstrap replicates. kya, thousand years ago.
(C) PCA based on genotype likelihoods.
See also Figures S1 and S2 and Tables S1 and S2.