
Figure 2. DH and PH Demographic Models Explored in Dadi and Projection Analyses.
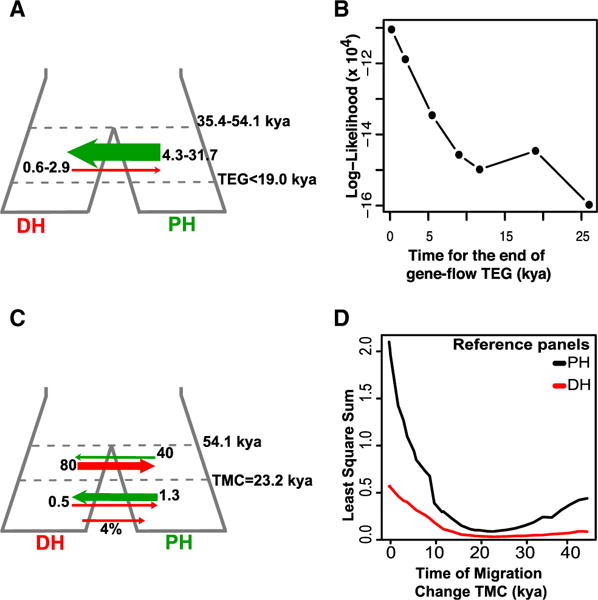
(A) Best two-population model supported by dadi.
(B) Dadi model Log(likelihood) for varying starting dates of isolation between DHs (Franches-Montagnes) and PHs (TEG).
(C) Best two-population model supported by projection analyses.
(D) Model LSS when considering varying dates for the change in migration dynamics (TMC) for the genome projections based on the DH (Franches-Montagnes, red) and PH (black) reference panels.
See also Table S3.