
Figure 4. DH Introgression into PHs.
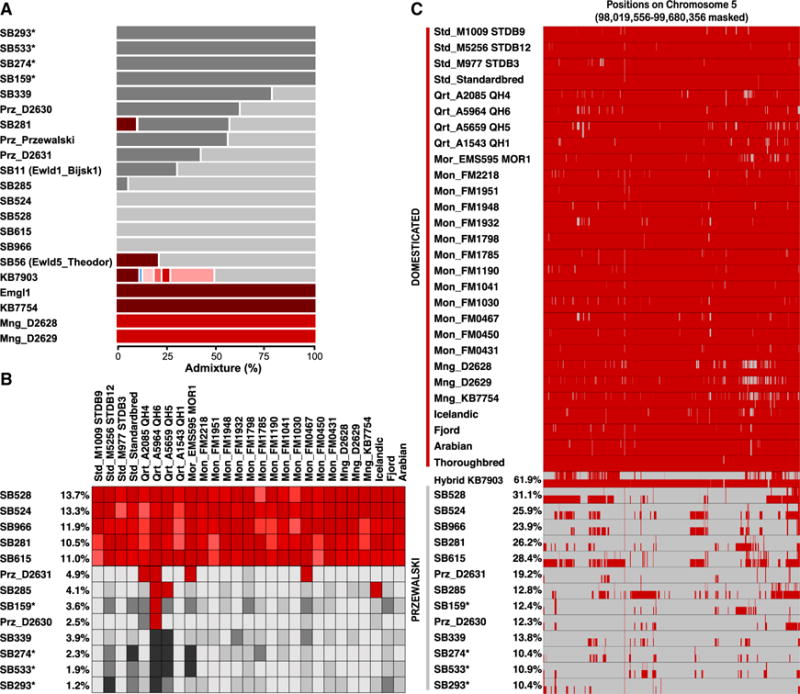
(A) Genetic components estimated in NGSAdmix (eight clusters). The gray and red gradients represent the PH and DH components, respectively.
(B) D statistic heatmaps. The tree topology (Outgroup,(PH,(DH,Paratype))) is tested for each DH and PH combination, disregarding transitions. Darker red colors indicate the admixture component in significant tests; darker gray shades indicate non-significant tests. The proportion of DH introgression within each PH genome, estimated by the average of f4 ratios involving Franches-Montagnes horses, is indicated next to the PH sample labels.
(C) Chromosome painting of DH (red) and PH (gray) ancestry blocks identified along chromosome 5.
Asterisk denotes A-line PHs. See also Figure S3 and Tables S4 and S5.