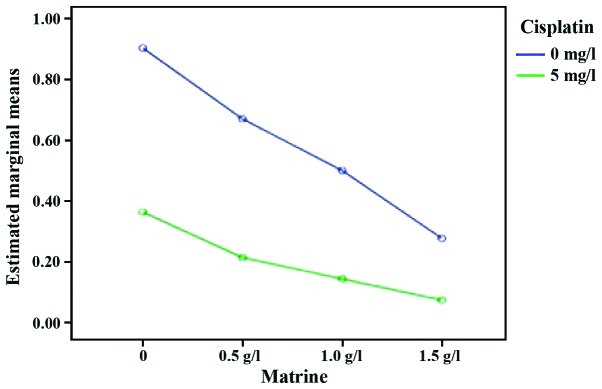
Figure 4.
Interaction effect sketch map (the expression level of XIAP in RD cells). The green line is the expression level of XIAP in the Mat group combined with cisplatin at different concentrations. The blue line is the expression level of XIAP in the Mat monotherapy group at different concentrations. Mat, matrine; XIAP, X-linked inhibitor of apoptosis protein.

