
Fig. 2. Molecular mechanisms of GABA-induced de novo gephyrin puncta and dendritic spine formation.
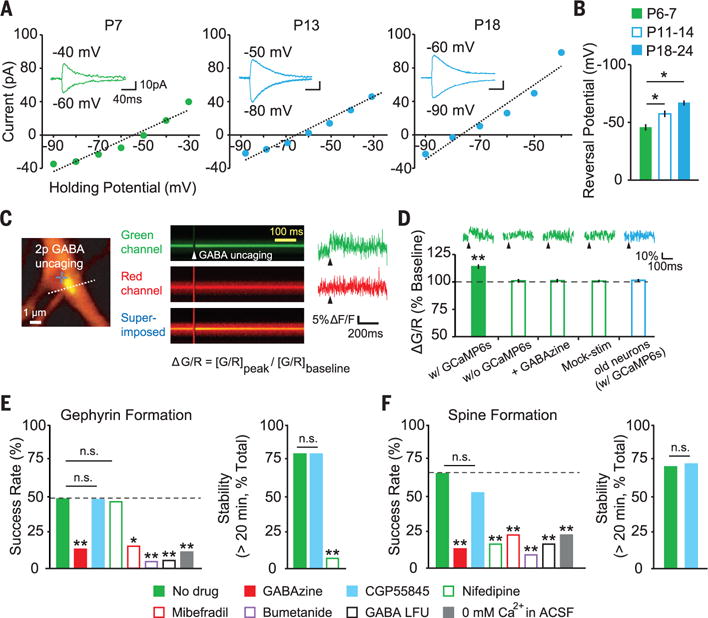
(A) Current-voltage curves measured by perforated patch-clamp recordings. (B) Summary graph of ECl at P6 to P7 (−45.9 ± 2.7 mV, n = 5), P11 to P14 (−57.2 ± 2.8 mV, n = 7), and P18 to P24 (−66.3 ± 2.1 mV, n = 6). (C) Image of a dendrite coexpressing GCaMP6s, tdTomato, and Teal-gephyrin. Dashed line indicates line-scan path. Green and red fluorescences were measured by line scanning before and after GABA uncaging. (D) Averaged traces and summary ΔG/R [(G/R)peak/(G/R)baseline, where G (green) is GCaMP6s fluorescence and R (red) is tdTomato fluorescence] in young (EP6 to EP8) and old (EP16 to EP18) neurons (with GCaMP6s, n = 13 cells; without GCaMP6s, n = 8; GABAzine, n = 9; mock stimulation, n = 9; old neurons, n = 8). (E and F) Success rate and stability of de novo gephyrin puncta and spine formation (no drug, n = 29 trials, 16 cells; 10 μM GABAzine, n = 30 trials, 17 cells; 3 μM CGP55845, n = 21 trials, 12 cells; 10 μM nifedipine, n = 30 trials, 14 cells; 10 μM mibefradil, n = 26 trials, 13 cells; 10 μM bumetanide, n = 21 trials, 9 cells; GABA LFU, n = 18 trials, 8 cells, 1 Hz; 0 mM Ca2+, n = 26 trials, 14 cells). *P < 0.05, **P < 0.01; error bars represent SEM.