
Fig. 3. Rapid accumulation of functional receptors at newly formed gephyrin puncta and dendritic spines.
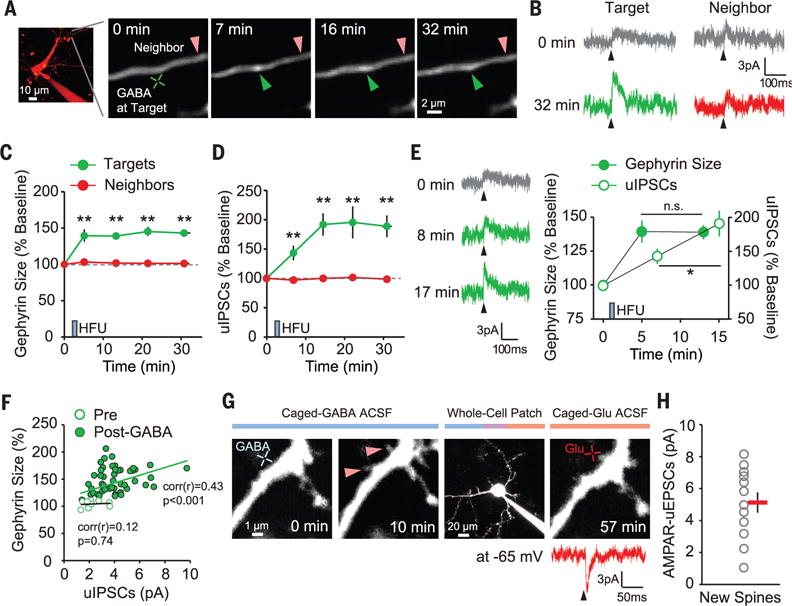
(A) Time-lapse images of a dendrite after GABA HFU. Green and red arrowheads indicate target and control spots, respectively. (B) uIPSC traces (average of 8 to 10 trials at 0.1 Hz, +10 mV) measured by whole-cell voltage-clamp recordings. (C and D) Time courses of the changes in gephyrin fluorescence (C) and uIPSC amplitudes (D) at targets (n = 10 regions) and neighbors (n = 10, 10 cells). (E) uIPSCs from a target at different time points. Time course of gephyrin fluorescence and uIPSC amplitude changes at targets. (F) Scatterplot between gephyrin expression levels and uIPSC amplitudes (n = 10 cells; up to 40 min). (G) Time-lapse images of a dendrite after GABA HFU (blue cross). Red arrowheads indicate new spines. uEPSCs were evoked by glutamate uncaging (red cross, 8 to 10 trials at 0.1 Hz, −65 mV) from a new spine measured by whole-cell voltage-clamp recordings. (H) AMPAR-mediated uEPSCs from newly formed dendritic spines (n = 12 spines, 5 cells). *P < 0.05, **P < 0.01; error bars represent SEM.