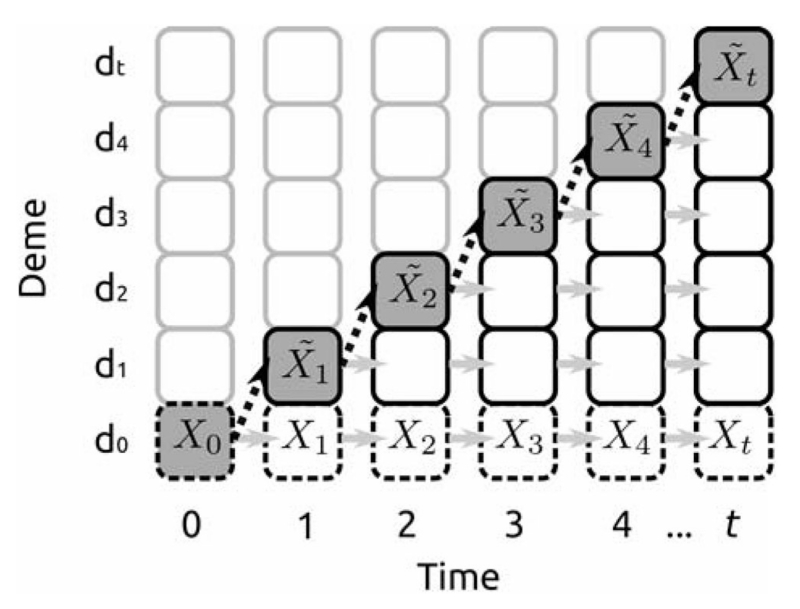
Figure 1.
Schematic of the expansion models studied. Each square corresponds to a subpopulation, with gray borders indicating subpopulations not colonized at a time step. Each time step, a new deme is colonized (black, dashed arrows), and other demes undergo neutral genetic drift (gray arrows). We compare the allele frequencies {Xt} at the expansion origin d0 (dashed borders) with the allele frequencies {} at the expansion front (shaded backgrounds).

