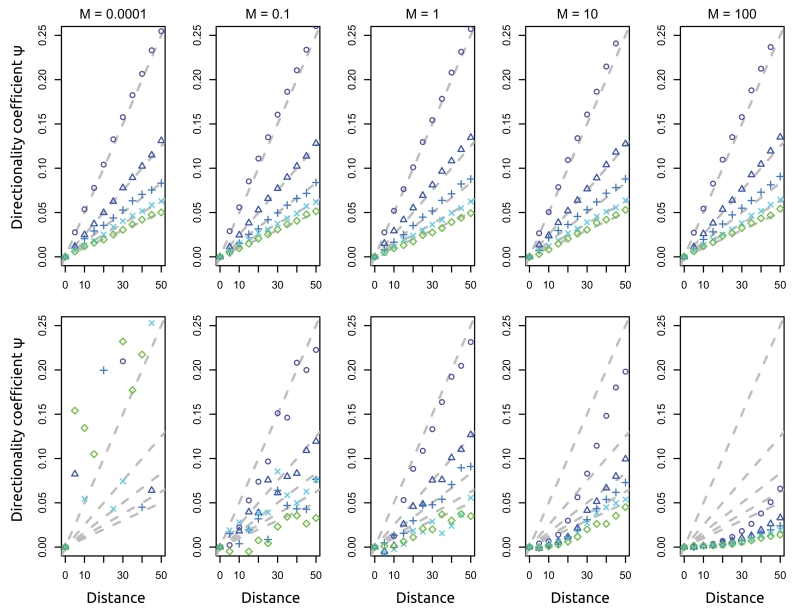
Figure 4.
Effect of migration rate and subsampling. Each set of points corresponds to ψ estimated from simulations under a specific ke value; ke varies from 100 to 500 in increments of 100 (top to bottom: circles/triangles/plus signs/crosses/diamonds, blue to green). Gray dashed lines give the expectation from the branching process model. Top row: data sampled immediately after the expansion finished. Bottom row: data sampled a very long time (20 Ne generations) after the expansion finished. Other parameters are as follows: sample size n = 10, time between expansion events te = 0.0001Ne generations.

