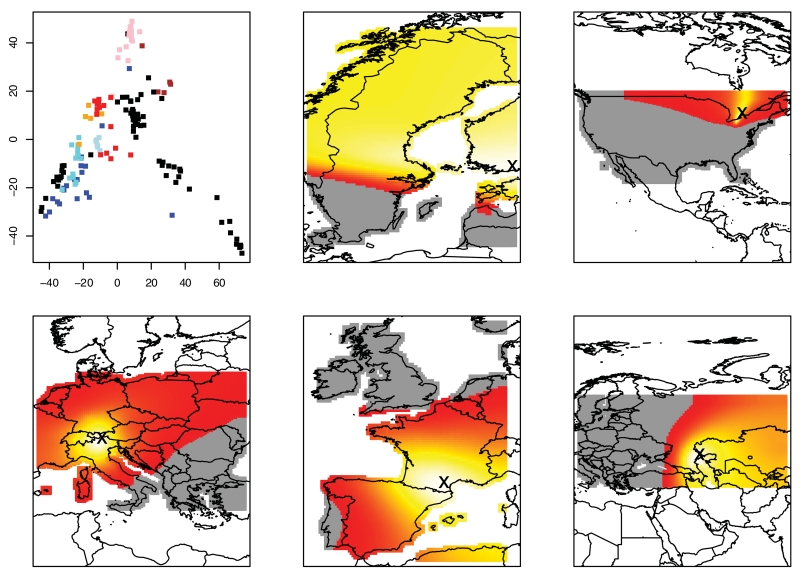
Figure 6.
Results for A. thaliana data set. Panel (a): PCA analysis of the 121,412 SNPs. Colors: green, Scandinavia; black, Americas; blue, UK; cyan, France; light blue, Spain and Portugal; red, North-Western Europe; orange, Switzerland and Italy; pink, Central Europe; brown, Russia, Lithuania, and Western Asia. Panels (b–f): Expansion for Scandinavia, United States, Central Europe, Western Europe, and Eastern Europe/Asia, respectively. Brighter yellow regions indicate more likely origin of expansion. Red and gray regions indicate unlikely origin.

