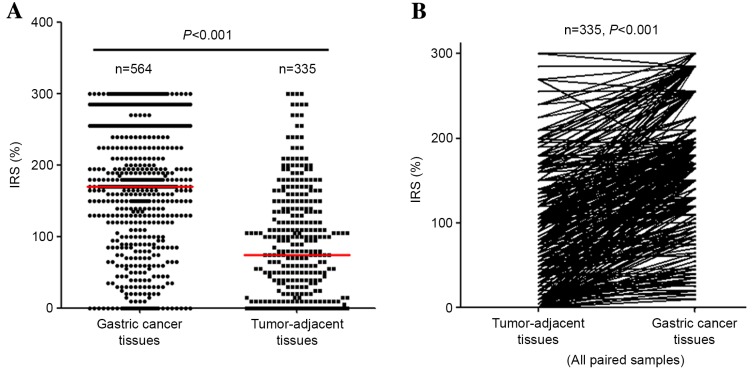
Figure 2.
The difference in PARP-1 IRS between gastric cancer tissue samples and tumor-adjacent tissue samples. (A) The distribution of staining by IRS; the red line denotes the median value; the P-value was obtained using a Mann-Whitney U test. (B) Each line represents the IRS for an individual gastric cancer case with tumor-adjacent tissue samples and cancer tissue samples; P-values were obtained from a Wilcoxon rank-sum test. PARP-1, poly (adenosine diphosphate-ribose) polymerase 1; IRS, immunoreactivity score.

