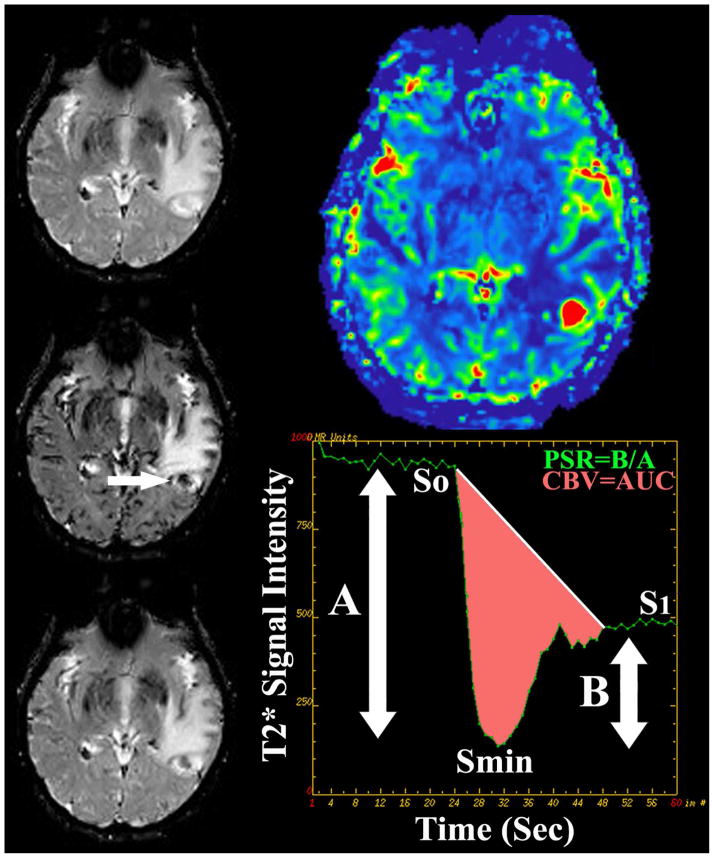
Figure 8.
DSC perfusion MR imaging in metastatic disease. 55 year old man with metastatic lung cancer presented for preoperative perfusion MR imaging. Sequential T2* weighted imaging prior to (top left), concurrent with (middle left), and following (bottom left) bolus intravenous power injection of gadiolinum contrast allows for the generation of signal intensity-time curve (bottom right) of intra-parenchymal metastatic disease (arrow). Integration of the area under the curve (pink shaded area) allows for calculation of cerebral blood volume (CBV) metrics. Percentage of signal intensity recovery (PSR) is calculated by dividing the relative post bolus signal intensity value (B) by the relative pre-bolus signal intensity value. Elevated CBV (top right) within the enhancing component of the enhancing focus is nonspecific for the diagnosis of neoplastic etiology (high grade glioma versus metastatic). Reduced PSR values have been shown to be specific for the initial diagnosis and subsequent recurrence of intra-parenchymal metastatic disease following standard therapy.

