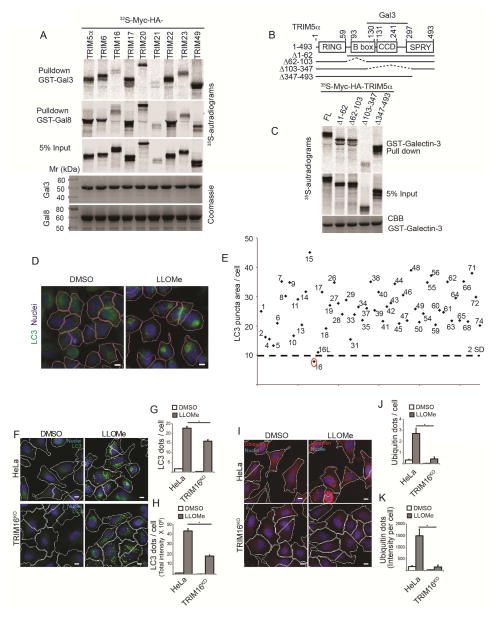
Figure 1. TRIMs and Galectins interact.
(A) GST pulldowns of in vitro translated and radiolabeled 35S-Myc-HA-TRIMs (as indicted) with GST-Galectin-3 and GST-Galectin-8. (B) Mapping of Galectin-3 interaction domain within TRIM5α. Deletion constructs of TRIM5a used in C. (C) TRIM5α constructs depicted in B were radiolabeled as in A and subjected to GST-pulldowns. with GST-Galectin-3. (D–E) siRNA screen of human TRIMs (identified by TRIM numbers) for effects on LLOMe-induced autophagosome formation by high content microscopy and automated image acquisition and quantification (HC). Panels in D, program-assigned masks superimposed on epifluorescent images of HeLa cells treated with LLOMe or DMSO vehicle. Pink mask, automatically defined cell boundaries (primary objects). Blue, nuclei stained with Hoechst 3342 (10 μg/ml). Red mask, machine identified endogenous LC3 puncta (target objects). Scale bar, 10 μm. Graph in E, Autophagosome abundance (total area of endogenous LC3 puncta/cell; staining with 1:500 antibody against LC3B; PM036 from MBL) in cells subjected to TRIM knockdowns in 96 well plates and treated with 0.5 mM LLOMe for 2 h (E). Dashed line, 2 SD below the mean (cumulative, LC3 puncta area/cell) for all TRIMs tested. N≥500 cells imaged per well. (F–H) Autophagic response (HC, LC3 puncta) to LLOMe (0.5 mM, 2 h) in HeLa cells and their CRISPR TRIM16KO mutant derivative A9. (I–K) Ubiqutination response, revealed with FK2 mouse monoclonal antibody (1:500 dilution; MBL D058-3) and quantified by HC (ubiquitin puncta, yellow mask) in HeLa vs. TRIM16KO HeLa mutant A9. Same conditions as in F–H. Data: means (n>3); t-test *, p < 0.05.

