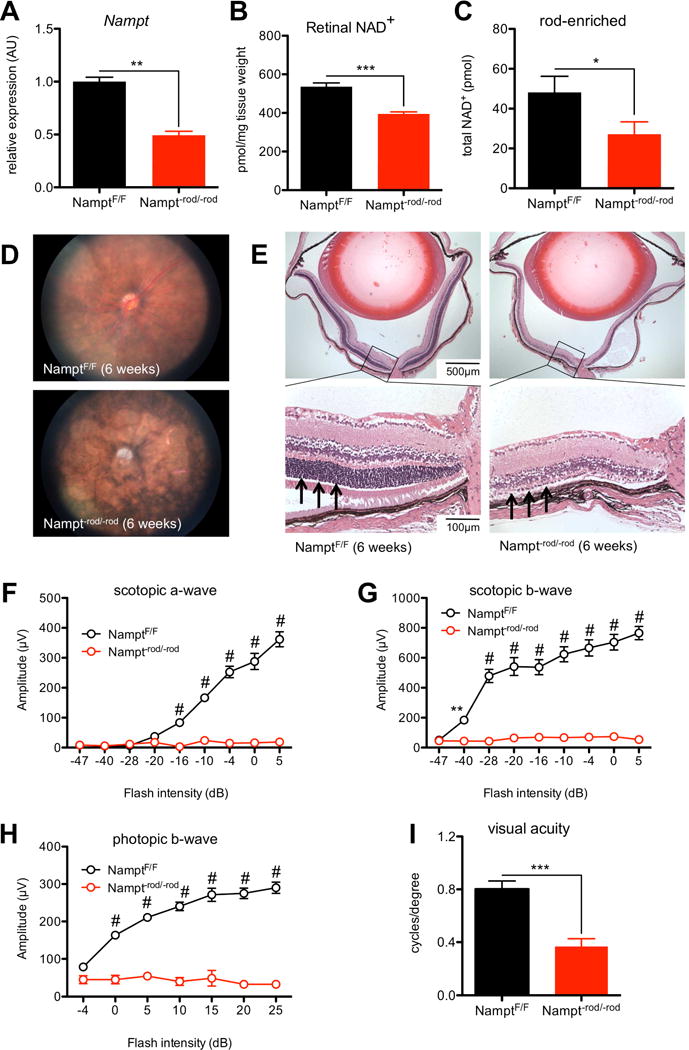
Figure 1.

Nampt−rod/−rod mice exhibit severe retinal degeneration. (A) Rod-specific deletion of Nampt caused significant reduction in Nampt mRNA expression from rod-enriched retinal isolates (n=7 isolates/group; Mann-Whitney U test). (B) Nampt−rod/−rod retinas had lower NAD+ levels than those from NamptF/F mice (n=5–8 retinas/group; 2-tailed, unpaired t-test). (C) Rod-enriched retinal isolates from Nampt−rod/−rod mice had lower NAD+ levels than those from NamptF/F retinas (n=9–10 pooled samples/group; 1-tailed, unpaired t-test). (D) Representative fundus images from Nampt−rod/−rod mice demonstrated severe signs of retinal degeneration including vascular attenuation and optic nerve atrophy. (E) Representative retinal sections from Nampt−rod/−rod mice at 6 weeks stained with hematoxylin & eosin showed significantly reduced outer nuclear layer thickness (see arrows) with secondary retinal degeneration. (F–H) Nampt−rod/−rod mice exhibited impaired retinal function on ERG (n=5 NamptF/F mice/10 Nampt−rod/−rod mice; 2-way mixed ANOVA with Bonferroni post-hoc test), and reduced photopic visual acuity (I; n=5–6 mice/group; 2-tailed, unpaired t-test). Graphs depict mean + S.E.M. (A–C, I) or mean ± S.E.M. (F–H) (* p < .05; ** p < .01; *** p < .001; # p < .0001).
