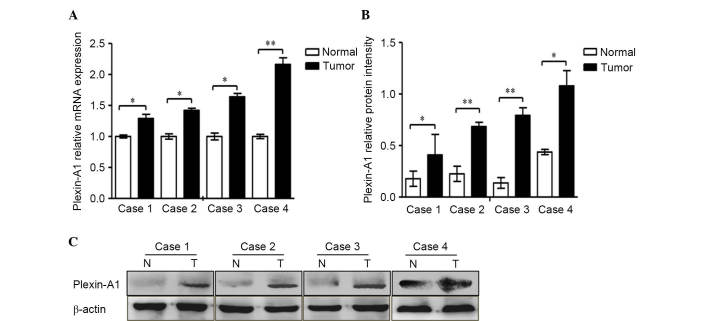
Figure 3.
Plexin-A1 was highly expressed in four cases of gastric cancer tissue. (A) The mRNA expression of plexin-A1 was obviously increased in cancer tissue compared with normal gastric mucosa. Plexin-A1 mRNA levels increased remarkably by 1.3, 1.4, 1.6 and 2.2-fold in tumors 1, 2, 3 and 4, respectively, compared with normal gastric tissue. (B) The histogram indicates the protein levels, which were normalized to the levels of β-actin protein. (C) The protein expression levels of plexin-A1 in all four cancer specimens were remarkably enhanced. Data are represented as the mean ± standard deviation (n=3 for each group, *P<0.05, **P<0.01). mRNA, messenger RNA; N, normal; T, tumor.

